Research helps investors to find out the potential of a security before they invest in it. Fundamental Research and Technical Research are two types of research used to first
analyze and then value a security. All stock market tips are formulated after thorough research by experts.
Importance of Research in stock market investments
Performing a research before making an investment is a must. It is only after a thorough research that you can make some assumptions into the value and future performance of an investment. Even if you are following stock trading tips, it ideal to do some research, just to ensure that you are making an investment that’s expected to get you maximum returns.
When you make an investment, in essence, you are buying tiny parts of a business with the hope of making a profit when the value of the business increases. Before buying anything, be it a car or phone, you do some degree of research about its performance and quality. An investment is no different. It is your hard earned money that you are about to invest, so you must have a fair knowledge of what you are investing in.
Technical Analysis of Stocks :-
Now, that you have learned how to do Fundamental Research, let’s take a look at Technical Research for making crucial share investment decisions. What we saw above was a fundamental factor responsible for the movement in the share prices. Besides these Fundamental factors there are Technical Factors viz. the
Laws of Demand & Supply
which also could lead to sharp movements in the share prices. These factors work on Mass Psychology and are closely linked to the Human Mind. Under a given set of circumstances, all minds tend to work in the same direction.
So, what exactly is ‘Technical Research’?
Technical Research is a study of the past price action to predict the future price Trends.
This means that the price of a share tells us as to how the share is going to move in the future and any reasons, let it be Fundamental or Technical, that could lead to a rise or a fall in the share prices is reflected in the price of that share. To give a simple example if a company is going to post excellent results, this will be reflected in the share price with a good rise which will be on account of insider buying. Similarly, the opposite of this also is true.
How accurate is Technical Research?
Technical Research is a subject which can successfully identify the beginning of a sharp rise or fall in the share prices. However, it is incorrect to say that technical research can predict the share movements correctly all the times, as at certain times the markets itself are undecided.
Then, why should I choose Technical Research. What are its advantages?
It is independent of any news or occurrence of events as any of these are reflected in the stock price.
Most of the Fundamental information such as announcement of Results or any other which affects the price of a share reaches a common Investor the last but an Investor following TA can get early signals based on price movements though he may not know the exact nature of information.
Since TA is based on Mass Psychology which can change and is fluctuating at times, Technical Research recommends use of Stop-losses which if strictly implemented can save Traders and Investors from a much bigger loss in the future.
Fundamental Analysis of Stocks :-
Fundamental analysis is a reliable method for evaluating the fair value of a company as well as predicting its future course and strategy. It especially comes in handy for companies lacking past share
Are you wondering why a trader should worry about fundamental analysis when market sentiments and price performance largely drive stock prices? Then ask yourself the following questions :
Have you ever wanted to own a multibagger penny stock but failed to predict whether the penny stock (with hardly any history of high prices) will see growth in the long term or not?
Do you have a problem being able to predict long-term stock prices based only on complex charts on past price movements?
Are you worried that the market trends based on which you invested in stock may be reversed at any moment?
If the answer is yes then it is time you started learning about fundamental research.
What is Fundamental Research?
Fundamental Research is a method of gaining actionable insights into companies and valuing their stock prices based not on the historical price movements but on the growth prospects of the underlying business. It involves analysing the financials, competitive advantages of the business, quality of the management and the competitive environment it operates in, among other factors.
The theory of fundamental research revolves around the fact that the market price of an asset may deviate from its fair value in the short term due to extraneous factors such as investor sentiment or market trends but will tend to move towards its real or intrinsic value over the long term based on the fundamental quality of the business model and its execution.

Sources of facts for fundamental analysis
The best sources for fundamental analysis are the following:
Draft Red Herring Prospectus (DRHP) –
It contains financial statements, market analysis, business plans, details on the management and litigations of the company. DRHPs are a great place to start understanding a company from the scratch.
Market analyst reports –
Usually available to only those customers who pay for these reports to the companies or internal teams that prepare such market intelligence reports
Annual, semi-annual and quarterly reports of the company –
These reports keep potential investors updated on the recent events and measures that affect the growth of the company as well as general information on finances and management.
Newspapers and business magazines –
These sources are usually more helpful in understanding key points and updates on both the company as well as different sectors and the economy in general.
What are the factors that analysts look for while analysing the fundamentals of a company?
Fundamental analysts believe that a firm’s fundamental factors are all reflected in the financial statements and are the true indicators of its earning potential and thereby, the future valuation of the securities. Some of the factors analysts may look at are-
Industry growth –
sometimes an average company may see strong growth due to the growth of the market in general
Competitive advantage of the company and ability to gain and sustain market share –
One must check the business model and strategy of the company and compare it to those of its competitors. Gaining market share often signals stock price growth.
Revenue and Profit growth –
One must be very careful while checking this section – a company may have massive operations but still fail to be profitable, stagnating its growth over time. High earnings often trigger stock price growth. At the same time, a lot of companies choose to reduce profits by paying huge interest payments in order to avoid paying high taxes on profits.
Quality of management –
A strong management team with adequate experience, networks, vision and business style can push through all sorts of challenges. Their quality of management can be apparent from their stated objectives as well as track record in the current and previous companies.
Financial ratios –
such as Quick ratio, Current ratio, P/E (Price to Earnings Ratio), etc. which give a clear picture of the financial health of the company – e.g. a company may be making large profits but it may not be enough to meet the liabilities on time due to a lack of liquidity. Such companies stand vulnerable to being wiped out in a single phase of a slowdown in the growth of either the company, the sector or the economy.
What is the significance of valuation in Fundamental research?
Valuation gives us the fair price at which the stocks should ideally be bought. It is based on the cash flows that the buyers are expected to earn over time. If the market price is above the fair price then the stock is said to be overpriced.
Difference between Fundamental Analysis and Technical Analysis
Fundamental analysis focuses on the underlying business – its financial health, business model, human resource management and competition etc.
In contrast, technical analysis focuses only on the historical price movement and stock-related data points such as relative strength index, moving average, MACD etc. It has more to do with investor sentiments towards the company and the market in general – it ignores future events and trends related to the company’s growth in terms of revenue, profit etc.
Types Of Stock Chart Analysis :-
Short Term Traders trade on the basis of daily charts as they are more interested in the immediate movement in the stock prices, whereas Medium term to Long term Traders are more dependent on weekly / monthly charts as they want more returns for which they are prepared to wait for a longer duration.
There are 3 types of charts which are commonly used by chartists. These are:
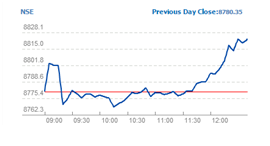
Line charts:
The closing prices are plotted on the graph and are joined to form a line.
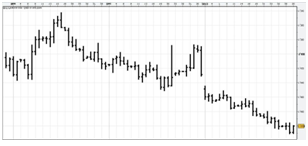
Bar charts:
The Bar uses open / high / low / close for the session.
Candlestick charts:
These charts also use open / high / low / close for the session.
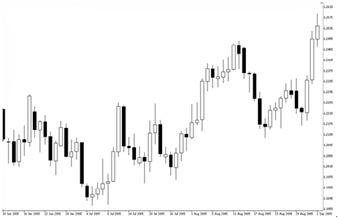
(The images given above for bar and candlestick charts are taken from Google for reference only. Don’t use them directly in any page as we may face a copyright issue.)
Tell me something about the Chart Construction for Technical Research?
The X-axis on a chart plots the periods for which prices are plotted and the Y-axis plots the value or the price of the share. This could range from a few hours to a few years. This means that prices can be plotted based on the prices that range from hours to years. Thus we could have minute charts as well as hourly, daily, weekly, monthly, quarterly, yearly charts based on the above data.The 4 quotes are normally in the order of-
- Open
- High
- Low
- Close
Let us see how a Bar chart and Candlestick chart is constructed with the help of the following illustration.Script A:-
| Opening Price on a day | Rs. 150 |
| High price of the day | Rs. 160 |
| Low price of the day | Rs. 125 |
| Closing price of the day | Rs. 130 |

In a Bar chart, the open is indicated by a small dash ( – ) which is drawn on the left side of the Bar, and the close by another dash on the right side of the bar. In a Candlestick chart, the real body i.e. the 2 ends of the body, show the opening and the closing price for the given period. The lines at the top and bottom of the real body are called the shadows, and they denote the high and the low for that session. The colour of the body denotes the open and the close of that session. If the open to close is on the higher side i.e. it is a bullish candle, the colour of the candle is white and if it is bearish then the colour of the candle is black. In some packages, green and red are used instead of white and black.
Comments are closed